

Smart Data
Smart Data portfolio wide analysis replaces estimates with verified metrics. One dashboard rolls up the portfolio and drills down to suites, showing where you’ve captured value—and where gaps remain.

Overview
Portfolio metrics are only as good as their sources. We anchor every KPI to reconciled measurements and give you a single place to see the big picture and the detail—clearly, comparably, and in time to act.
Source certainty, not guesswork
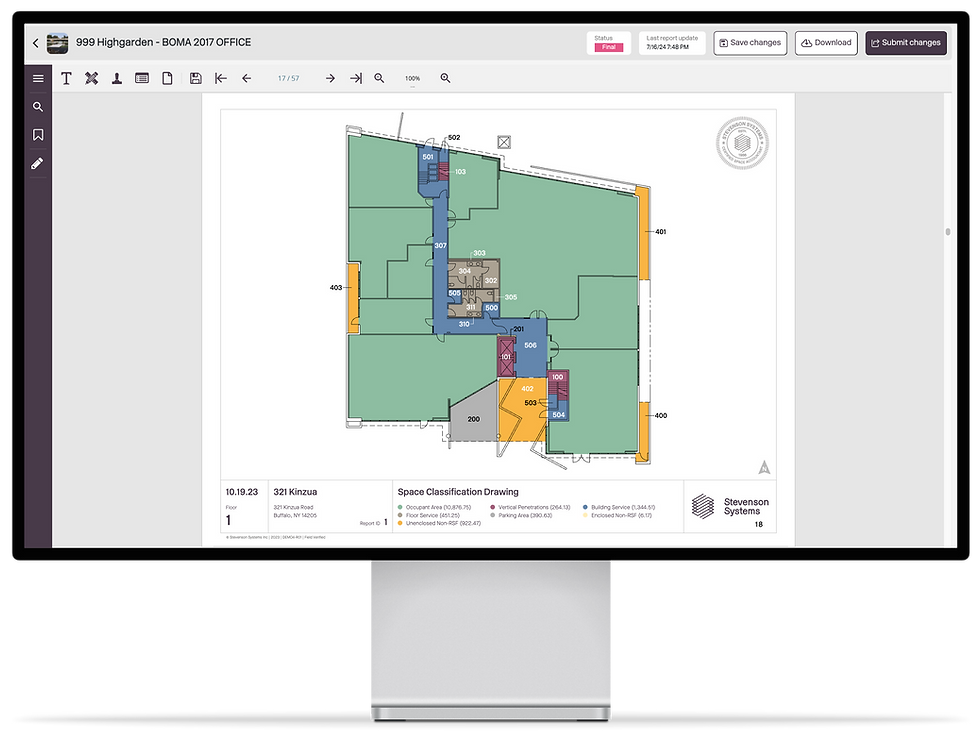
KPIs built on verified RSF/USF; every number traces to drawings and standards—no “based on estimates” caveats.Smart Data
Portfolio rollups that you can click through: portfolio → building → floor → suite/team.
Valid side-by-sides
Cross-asset normalization so apples-to-apples holds across geographies, vintages, and asset types.
Year-over-year tracking of verified square footage growth and utilization.
Forecasts that stand up
Projections grounded in measured reality—projected vs. actual occupancy shown together to expose drift early.Smart Data
Variance narratives that link back to changes on the plan (reconfigs, TI, relocations).
Critical financial clarity
Surfaces the “quiet” ~2% erosion that gets missed when data is estimated or stale; shows where value was captured—and where it wasn’t.
Turns quarter-end reporting from compilation to confirmation; less time chasing files, more time deciding.
Operational visibility
Reconfigurations, renewals, and relocations are visible events in the data, not buried footnotes.
One dashboard. Verified metrics. Actionable clarity.
Where generic dashboards fall short
If inputs aren’t verified—or can’t be traced to the plan—comparisons collapse and decisions drift. Smart Data restores provenance so the portfolio view holds up under scrutiny.
Deliverables
Dashboards gain provenance—every KPI ties back to verified measurements and the drawing.
Portfolio reviews move from noise to signal: fair comparisons, visible variance, faster calls.
Forecasts hold up because inputs are normalized, current, and traceable.
Outcomes
Comparable KPIs across assets; drill-downs to building/floor/suite with audit trail
Early detection of gaps (including the “lost” ~2%) and clear identification of where value concentrates
Faster, more credible reviews for executives, asset managers, and finance teams
What Changes in Our Hands
Dashboards gain provenance—every KPI ties back to verified measurements and the drawing.
Portfolio reviews move from noise to signal: fair comparisons, visible variance, faster calls.
Forecasts hold up because inputs are normalized, current, and traceable.
Connect
See How It All Works Together
Each service builds on the next to give you unmatched visibility, confidence, and control over your portfolio. It starts with precision — as-builts, measurement reports, and standards that define every square foot with absolute accuracy. Then, TruSpace™ extends that foundation with centralized data access, seamless suite and tenant updates, space optimization strategies, and portfolio-wide analytics that turn raw numbers into powerful decisions.
Explore how these solutions connect into one continuous system — from the first measurement to the most strategic insight — and see how much more your square footage can become.
Data Centralization
One governed source—plans, stacks, updates, and analytics that stay in sync.

Square Footage Optimization
Usage vs. allocation is proven—value opportunity is made specific and trackable.

As-Built Floor Plans
Built on evidence—captured in the field, reconciled to the record.
Measurement Reports
Beyond the scan—standards and records reconcile what lasers can’t see.

Space Accounting
From measurement to value—governed space strategy across the asset lifecycle.

Certification & Standards Application
Independent verification; standards stated, certification assured.

Orders & Occupant Services
Current by design—updates evidenced and auditable.

Smart Data
Portfolio insight with provenance—viewable over time by building, floor, and suite.
Start With One — Unlock What’s Hidden in Your Space
Every portfolio transformation begins with a single property.
